Find out what a motorcycle actually pulls before you buy it.

A spec sheet gives you horsepower. It won’t tell you how a 500 gets to 100 km/h with a rider on board. SpeedCharts times that with your phone’s GPS, so you can compare bikes on the same terms.

100%free. No ads, nothing to unlock
No sign-upno account, no email, nothing to register
No nameson purpose. See below
SpeedCharts
−1G+1G
72km/h
0–50 km/h
2.1 s
0–100 km/h
4.9 s
50–100 km/h
2.8 s
80–100 km/h
1.4 s
Start measurement
After the measurement

Three things you can do with one run.

Everything below comes from the same ten seconds of riding. Keep scrolling to step through it.

SpeedCharts
Honda CB500F 2023rider 81 kg · GPS
0306090120km/helevation · +1.7 m over the run0–50 · 2.1 s0–100 · 4.9 sYamaha MT-07 · 3.5 sKawasaki Z650 · 3.8 sHonda CB500F · 4.9 s0 s10 s
0–50 km/h2.1 s
0–100 km/h4.9 s
50–100 km/h2.8 s
Same measurement, other bikes0–100vs this
Honda CB500F · 20234.9 s
Yamaha MT-07 · 20233.5 s−1.4 s
Kawasaki Z650 · 20213.8 s−1.1 s
Honda CB500F · 20230–100 in 4.9 s
Rider 81 kg · peak pull 0.63 Gspeedcharts.app
Stage 01

The chart

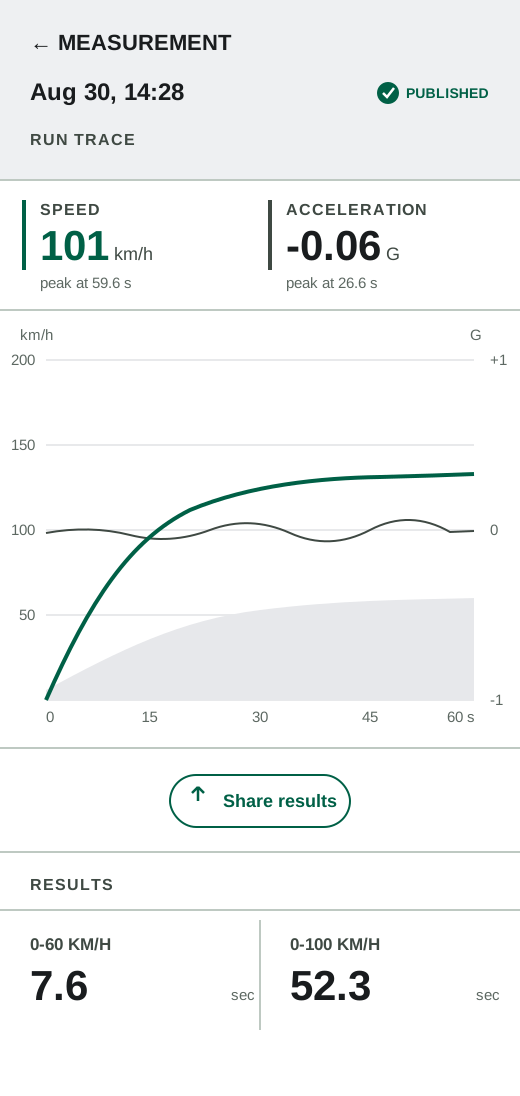
Speed, G-force and elevation on one time axis. Speed is where the splits come from, elevation tells you whether the road was flat, and the G trace is left raw because every notch in it is a gear change.

Speed130 km/h
G-force+0.02 G
Elapsed10.0 s
Stage 02

Against other measurements

Lay other measurements over the same axis: different motorcycles, or other runs of the same model in other people’s hands.

Nothing is measured again. Only what you are comparing against changes, so the gap you see is a gap between bikes and not between two ways of timing them.

Ghost curves: Yamaha MT-07, Kawasaki Z650

Stage 03

The summary card

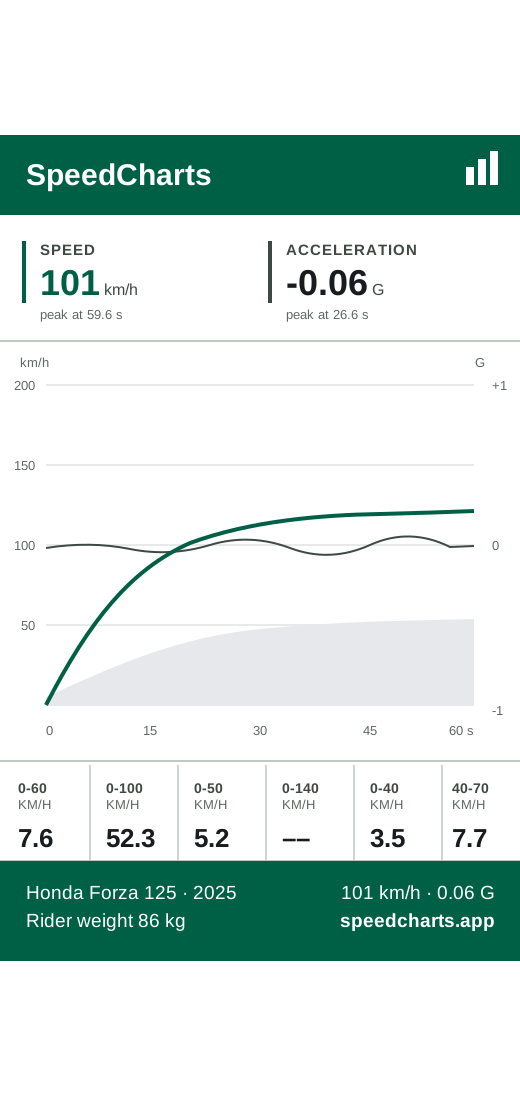
The run exports as an image: the curve, the splits, the bike and the rider weight, nothing else.

One tap to share it on Instagram, a forum or a group chat. It is sized to stay readable in a feed, so nobody has to open the app to see what your bike does.

1080 × 1350 px · PNG

01

Scroll to play it through, or drag the marker

Compare bikes

The 0–100 time doesn’t tell you how a bike pulls.

Two motorcycles can reach 100 km/h within a tenth of each other and still feel nothing alike, because they make their speed in different places. Overlay the curves and you can see where.

Honda CB500F
Honda CB500FYamaha MT-07Kawasaki Z650
Overlaid speed curves, 0 to 10 seconds80–100 km/h · the overtaking band0306090120km/h0246810seconds1.4 s1.1 s1.0 s

show_chart  The shaded strip is 80–100 km/h, overtaking speed. Each bike’s bracket inside it is its roll-on time: how far apart the two crossings sit. The wider the bracket, the more you have to plan an overtake.

Motorcycle0–500–10050–10080–100
Honda CB500F 2023 · rider 81 kg2.14.92.81.4
Yamaha MT-07 2023 · rider 99 kg1.33.52.21.1
Kawasaki Z650 2021 · rider 96 kg1.73.82.11.0

Watch how the order changes between columns. The bike that leaves the line first isn’t always first to 100, and neither is necessarily the one you’d want under you when a van pulls out. All times are in seconds, measured the same way, with rider weight published beside each one. There are no rider names anywhere on this site. Measurements are filed under motorcycles, deliberately. (The figures on this page are samples. The shape of the curves is the point.)

The same bike, other hands

The same model, measured 11 times.

These are 11 measurements of one motorcycle model, taken by different riders on different days. The spread between them is the margin of error you should read into every other number on this page.

Honda CB500F · 11 measurementsquickest 4.4 s · median 4.9 s · slowest 5.5 s
050100km/h0 s10 s

The grey band covers all 11 runs. The dark line is the measurement the rest of this page has been using.

What moves it

Where the spread comes from

Rider weight

The biggest single variable on a small bike. Twenty kilos is worth a tenth or two on a 500, which is enough to swap the order of two otherwise equal models.

Surface and slope

Grip decides how much of the engine reaches the road, and a slight downhill flatters a time. Every measurement carries its elevation trace so you can check whether the run was flat.

The launch itself

Clutch and throttle in the first second account for most of the width of that band. It’s also why the median of many runs says more about a motorcycle than any single quick one.

Reading it for a purchase

Half a second between two models is a difference you’ll feel. A tenth is noise; the same bike produces that much scatter on its own. Compare medians rather than best runs.

Reading it for your own bike

If your measurement sits outside the band entirely, check the bike before you blame the app. A worn chain, low tyre pressures, a slipping clutch or a fouled air filter will show up here before you notice them anywhere else.

Why there are no names here

No leaderboard, on purpose.

The point is to compare motorcycles, not people. A public ranking of nicknames would turn a measuring tool into a competition, and a competition about going fast is a dangerous thing to hand riders. So every measurement is attached to a bike: no accounts, no profiles, no rider names.

What a published measurement contains

  • Speed, G-force and elevation over time: the curves, exactly as measured
  • The motorcycle: make, model, year
  • Rider weight: without it, comparing small bikes means nothing

What it never contains

  • GPS coordinates: never stored, never uploaded. Position is used to work out speed on the phone, then discarded.
  • Your route: the app keeps no map of where you rode, so there is nothing to leak or scrape.
  • You: no name, no handle, no avatar, no email, no account

Measure somewhere safe and legal: a private surface, a track day, a closed road. SpeedCharts is a measuring instrument. It is not a reason to ride faster on a public road. Nothing here rewards a bigger number, and the elevation trace makes a downhill run easy to spot.

Questions riders ask

Everything else worth knowing.

On purpose. A ranked list with names on it turns a measuring tool into a competition, and the road is a bad place for one. Measurements are attached to motorcycles, so what you compare is models. There is no way to make an account, which also means there is nothing to climb.

0–100 km/h is the figure every manufacturer and magazine quotes, so it is the one you can compare against. It also separates small and mid-capacity bikes clearly, and you can reach it without holding speeds that have no business on a public road. Top speed tells you almost nothing about a bike you’d actually ride, so it isn’t the headline here.

No, and you can’t make one. The app pairs with speedcharts.app through an anonymous install ID. Reinstall the app and you start over with a clean, unlinked one.

No, and that includes me. GPS coordinates are used to work out speed and then thrown away. They are not in the run record on your phone and not on the server. A published measurement carries speed, G-force and elevation over time, the motorcycle, and rider weight. That is the complete list.

Accurate enough to compare bikes. Don’t expect it to split hairs. The chart above shows the real spread on a single model: over a second between the quickest and slowest measurement of the same motorcycle. A half-second gap between models means something. A tenth is noise.

No. Publishing is a deliberate action you take per measurement, and you never have to take it. You can use SpeedCharts entirely privately and nothing leaves your phone. Anything you do publish is checked before it appears — most go up straight away, and anything unusual waits for a person, usually less than a day. You can withdraw it later, and your own copy stays on the phone either way.

Free · no account · nothing on the bike

Look at the numbers before the test ride.

Install SpeedCharts and measure your own bike once. That gives you a reference point for every bike you look at afterwards.